Blog

  • Make radioactive decays visible: cloud chamber with Peltier modules

    Cloud chambers are one of the most beautiful ways to see ionising radiation. After wanting one for a long time, I built a compact version based on Peltier cooling, using mostly off-the-shelf components and an old PC power supply.

    Below I explain the design, the physics behind it, and a few practical lessons learned.


    The Design

    The chamber is built around a two-stage Peltier cooling stack designed to reach sufficiently low temperatures on a graphite plate, where the particle tracks become visible.

    Main components

    • Acrylic (plexiglass) box — the enclosure where the vapor supersaturation occurs
    • Graphite plate — the cold surface where condensation tracks form
    • Two Peltier modules in series — create the temperature gradient
    • Heat sink with fan — removes heat from the hot side
    • Paper soaked with isopropyl alcohol — vapor source
    • PC power supply — provides the high current required

    Why Two Peltier Modules?

    To reach low temperatures efficiently, the system uses two Peltiers stacked thermally:

    1. Lower Peltier (hot side → heat sink)
      • Optimal voltage: ~16 V
      • Current: ~7 A
      • Purpose: remove most of the heat
    2. Upper Peltier (cold side → graphite plate)
      • Optimal voltage: ~3 V
      • Purpose: fine cooling of the plate

    This configuration creates a strong temperature gradient while keeping the graphite plate stable.

    Power supply choice

    The optimal voltages are not standard, so instead of a dedicated lab supply I used an old PC power supply:

    • Provides high current reliably
    • Readily available and portable
    • Outputs only fixed rails (12 V and 3.3 V)

    Although not ideal, this setup still cools the graphite plate to about −30 °C (-25 °C is the temperature for the alcohol to be in the supersaturated state), which is sufficient for cloud chamber operation.


    How an Alcohol Cloud Chamber Works

    Inside the acrylic box, a strip of paper soaked in isopropyl alcohol continuously evaporates, filling the chamber with vapor.

    Because the bottom graphite plate is very cold while the top is warmer, a supersaturated layer forms near the plate.

    When a charged particle passes through this region, it ionises the vapor along its path.
    The ions act as nucleation centers, causing tiny droplets to condense — making the particle’s trajectory visible as a thin white track.


    Observing Particle Tracks

    With no radioactive source, the chamber still works — but the rate is low.

    In my setup:

    • Typical waiting time for a clear track: a couple of minutes
    • Most visible tracks are likely alpha particles

    When a small radioactive source is placed nearby, the track rate increases dramatically, making the chamber much more visually engaging.


    What Makes This Build Interesting

    Compared to many DIY cloud chambers:

    • Uses Peltier cooling instead of dry ice
    • Powered by a repurposed PC power supply
    • Compact and portable
    • Demonstrates that precise lab supplies are helpful but not strictly necessary

    Final Thoughts

    This project sits at a nice intersection of physics, electronics, and hands-on making.
    Even with non-ideal voltages, reaching −30 °C on the graphite plate is enough to reliably visualise radiation — turning an invisible phenomenon into something tangible.

    It’s a reminder that with a bit of ingenuity (and a spare power supply), you can build real particle detectors on a desk.

    Credits: first time I saw a Peltier cloud chamber was in a presentation done by a Japanese colleague in a conference in Tokyo

  • Vibe coding: building an asset management web app — and teaching it to speak SQL

    Managing hardware for a large detector is as much an information problem as it is an engineering one.
    Over the past weeks I built a web application to manage the CMS Tracker backend assets and their topology, with the goal of creating a single operational view of devices, connections, and status.

    This post explains what the project is, how it’s structured, and why one feature — a natural-language query interface powered by an LLM — turned out to be surprisingly useful.


    The problem: fragmented operational knowledge

    Backend hardware ecosystems evolve organically. Boards move between crates, optical links get re-patched, firmware changes, and components are replaced.

    The information exists — but often across spreadsheets, ad-hoc notes, and multiple small tools. The result is friction:

    • It’s hard to answer simple operational questions quickly
    • Inconsistencies creep in
    • The cognitive load for shifters and experts grows

    The goal of this project was to create a single source of truth that is:

    • Structured and consistent
    • Easy to update safely
    • Immediately useful for day-to-day operations

    What the application does

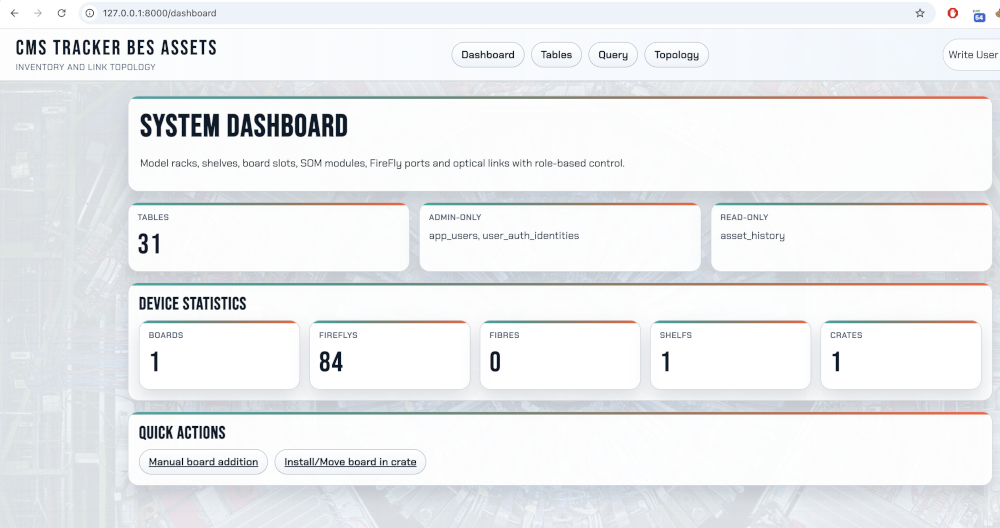
    At its core, the app is an asset and topology manager for CMS Tracker backend hardware. It provides:

    • Inventory of ATCA assets (boards, crates, racks, slots, power)
    • Tracking of linked components (SOMs, IPMCs, FireFly modules, fibres)
    • Role-based access control (reader, writer, admin)
    • Automatic propagation of status and location when hardware is installed or moved
    • A normalized relational data model to keep updates consistent
    Figure 1 — System dashboard showing global inventory and quick statistics

    The emphasis was not only on storing data, but on making operational workflows explicit — for example, installing a board updates multiple related entities automatically, reducing manual bookkeeping.


    Architecture in a nutshell

    The stack is intentionally simple and pragmatic:

    • Backend: FastAPI
    • Database: PostgreSQL with a normalized schema
    • ORM layer: SQLAlchemy Core with reflection
    • Auth: role-based with future CERN SSO integration
    • UI: server-rendered templates focused on clarity over complexity

    The app works directly on an existing schema, so it can evolve with the hardware model without heavy refactoring.


    The interesting part: natural-language queries → SQL

    One feature I wanted to experiment with was lowering the barrier to querying the database.

    Operational questions are often phrased in plain language:

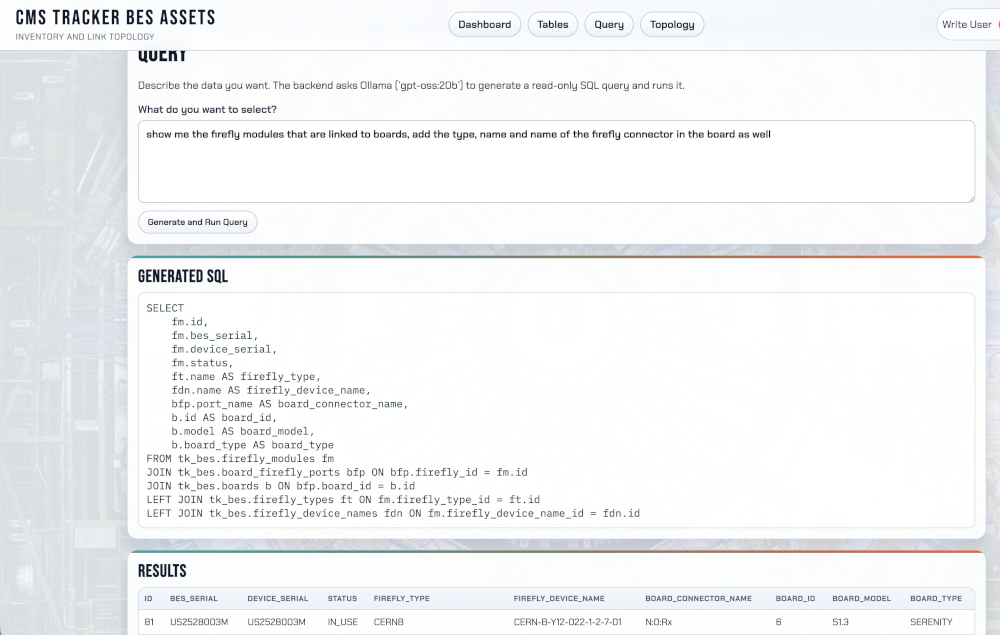
    “Show me the FireFly modules connected to boards, including type and connector.”

    Instead of requiring users to write SQL, the app includes a Query page where you describe the data you want.

    The backend then:

    1. Uses an LLM to generate a read-only SQL query
    2. Validates and executes it
    3. Displays both the query and the results
    Figure 2 — Natural-language query interface with generated SQL and results

    Why this is useful in practice

    This feature isn’t about replacing SQL — it’s about speed and accessibility.

    1. Faster operational checks

    You can ask ad-hoc questions without remembering table structures.

    2. Transparency and trust

    Showing the generated SQL makes the process auditable and educational.

    3. A bridge between mental and data models

    People think in terms of devices and links, not joins — the interface translates between the two.

    4. Safe by design

    Queries are generated as read-only, preventing accidental modifications.


    Lessons learned

    Modeling matters more than UI

    A clean schema with explicit relationships made everything else easier — including LLM prompting.

    LLMs work best with constraints

    Providing schema context and enforcing read-only execution keeps outputs reliable.

    Small operational tools have big impact

    Even simple visibility improvements reduce friction in daily work.


    What I’d like to explore next

    • Graph visualization of topology
    • Query history and saved operational views
    • Tighter integration with authentication (SSO)
    • Automated consistency checks across links

    Final thoughts

    This project sits at the intersection of detector operations, software engineering, and human-computer interaction.

    The most rewarding aspect is that it’s immediately useful: a tool built not as a demo, but as part of the operational workflow.

    And the LLM query interface is a small glimpse of how interacting with complex technical systems might become more conversational — while still grounded in precise, auditable data.